 In today’s digital economy, data is currency. In order to understand why it is so valuable, we first have to understand what it is. What is Data? Data is all around us and we use it every single day. Data is a collection of facts, such as numbers, measurements, observations, words, or descriptions of things. In short, it is a value assigned to a thing. Consider that you have a name, height, weight, age/date of birth, social security number, nationality, income level, shoe size, etc. All of these things are different types of data about you. There are two primary types of data: quantitative and qualitative Quantitative Data: These are values and/or counts that can be measured objectively. These are always numerical. In the business world this can be sales data, profits, costs. In the non business world this can be things like weight, temperature, length, width, height, volume. When you think quantitative data think “How much or how many?” There are 2 types of quantitative data: continuous and discrete. 1) Discrete: Data that has a finite level of detail and is typically an integer. A great example is counting people. You can’t count 2.5 people. There are 2 or 3 people with no in-between. 2) Continuous: Data that can be cut to various levels of detail. Time is an excellent example. You can measure time in centuries, years, months, days, weeks, etc. Time is continuous because we can measure it at progressively more precise scales. In general, if you are counting something then it is discrete. Measurements will be continuous. Qualitative Data: Non-numerical groupings that are created when you classify or categorize something. These groupings represent different “cuts” that can be made to the data. In business this could be sales region, channel, product line, brand. In the non business world it could be colors, shapes, textures, smells, opinions. When you think qualitative data think “What kind or how is it?” There are 3 types of qualitative data: nominal, ordinal and binary 1) Nominal: Categorical data that falls into unordered categories. Examples include hair color, race, and smoking status. There is no natural order or ranking to these values. 2) Ordinal: Categorical data that falls into naturally ordered categories. Examples include education level (grade school to PhD), satisfaction (bad to great), or pepper hotness (mild to scalding hot). All of these examples follow a structured progression. 3) Binary: A type of categorical data in which there are only 2 categories. Binary data can be either nominal or ordinal. Examples include right/wrong, up/down, yes/no, on/off. Putting it all together: If a company wanted to know their sales by product shape and region they would segment their quantitative measure (sales) by qualitative dimensions (product shape and region). Data Types There are also differences in the types of data you can use: Primary Data: Data you or your organization collected directly, usually as a result of doing business. Examples include sales data, purchasing data, customer lists, employee list. Secondary Data: Data you or your organization gets from another source. Any government data used by business, such as data from the census bureau, would be secondary data. Other examples include purchased marketing lists, custom surveys, or market research reports. Structured Data: Clean, organized data that can easily be understood by a computer (also called machine readable). Think of data that can be easily accessed by a spreadsheet or database. Structured data can be used in many different ways, can be searched & versioned easily, and is readily transferrable between systems. Unstructured Data: A lot of our correspondence is in unstructured format. Think of e-mail, images, text, video, etc. While it is exceptionally easy for a human to process and understand this type of information, a computer struggles to understand it because the data has no fixed underlying structure. As such, it does not know how to process the information. This can also be called non machine readable data. Example of Unstructured Data E-Mail Message 1: Matt called and said the sales meeting with customer XYZ needs to be moved to 3PM Central time on Thursday, 8/30/18 E-Mail Message 2: James has confirmed the proof of concept call with customer ABC on Monday (8/27) at noon Eastern Time E-Mail Message 3: The Tuesday, 2PM Pacific time meeting on 8/28 with customer DEF about invoicing issues has been canceled, per John Now let’s structure this data! Example of Structured E-Mail Data This is the exact same data as the e-mails above, but it is stored in a clean, consistent format. A computer can easily understand this now. 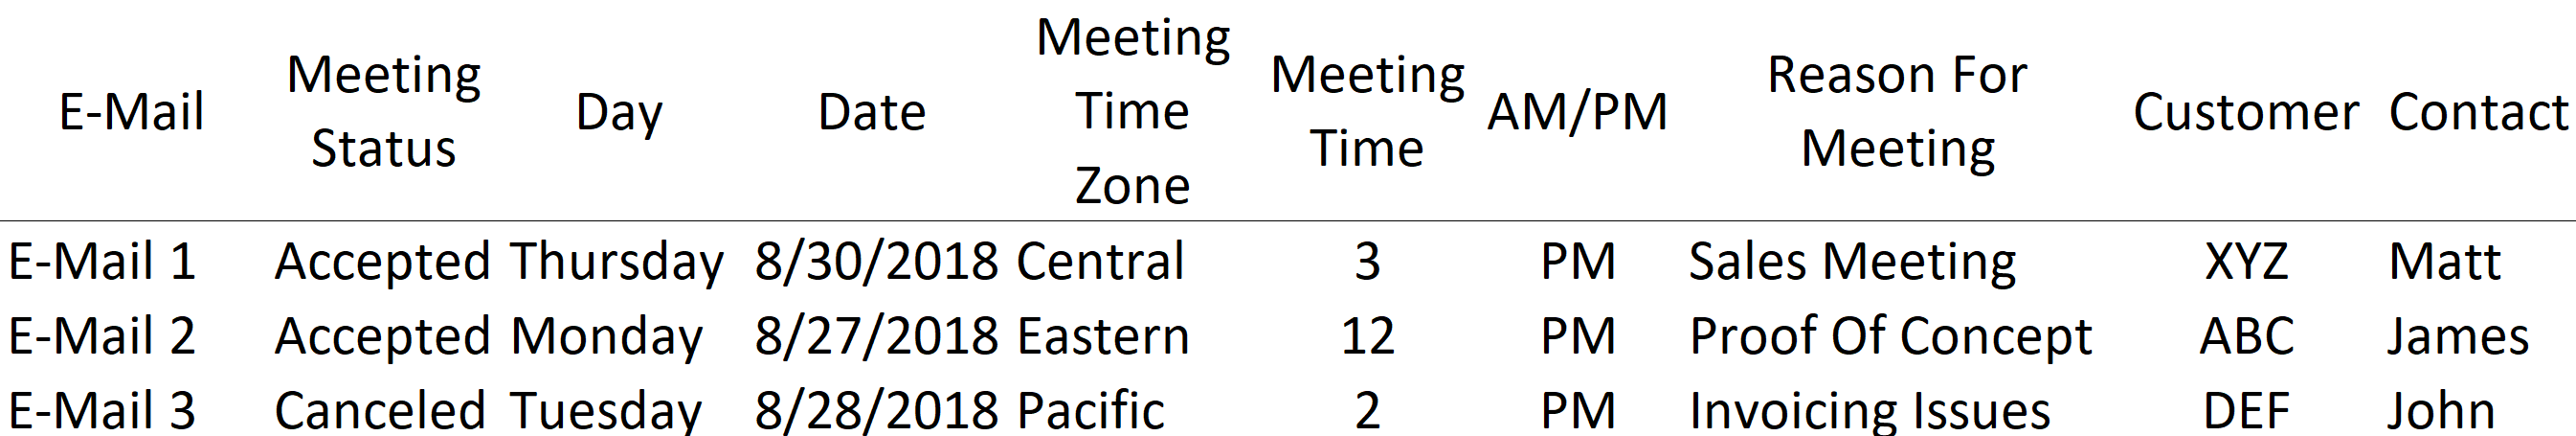 Statistical Analysis Another essential component of data literacy is understanding basic statistical analysis. Data is collected and statistics are applied to extract insights from the data. There are two primary ways to collect data for things like surveys and market research: Census: An official count or survey of a population that typically records various details of individuals. The goal is to count every single member of a population. An example would be the US population census conducted by the Census Bureau every 10 years. This is a excellent method of collecting high quality data, but is very laborious, time consuming, and expensive. Sample: Counting an entire population might not be feasible, in which case a subset of manageable size will be selected from the population. The best way to avoid bias in the sample population is to do a random selection. Statistics are calculated from the samples and extrapolations are made from the sample to the population. We can use different types of statistics to analyze data:
Part 3 of this data literacy series, Cognitive Biases – Powerful, Necessary, and Potentially Harmful, will discuss biases and how they impact our ability to process information and extract insights. Be sure to check out the rest of this introduction to data literacy series: Part 1: Why you MUST Be Data Literate In Business Today Part 4: Data Literacy Playbook: A Path To Business Superpowers Like this content? Be sure to join our newsletter list and follow me on LinkedIn. Comments are closed.
|
�
Follow me on LinkedIn for daily content on analytics, data, strategy, and business
Categories
All
|
ServicesResources |
Company |
|